Epidemiology
Risk of firearm-related harm varies by demographics, geography, and other factors
Firearm injury is a major public health issue, causing premature death, long-term physical and emotional disability, significant direct emergency and medical expenses, and economic costs to society.
Firearms are the leading cause of death for adolescents ages 15-19 and young adults ages 20-24 in the US.1 Firearm-related harm is disproportionately distributed across demographic groups: older white males and American Indian/Alaskan Native males have the highest rates of firearm suicide, while rates of homicide and interpersonal firearm injury are highest among younger Black males. Rates of firearm death also vary according to geographic region, urban-rural status, and socioeconomic and structural inequity.
Firearm Deaths in the United States
More Americans now die each year from firearms than from motor vehicle crashes, with firearm deaths surpassing motor vehicle deaths in 2017 and the gap continuing to increase since.1 In 2020, there were 45,222 gun deaths, the highest number ever recorded, driven by a dramatic increase in gun homicides and a persistently high number of gun suicides.2 Of total firearm deaths, 54% (24,292) were suicides and 43% (19,384) were homicides (not including legal intervention). 1 In addition, 53% of all suicides and 80% of all homicides were by firearm.
Although public mass shootings garner much media and political attention, they account for less than 1% of all firearm deaths nationwide each year.1,3
Firearm Homicide Rates for Males by Age and Race/Ethnicity, 2020
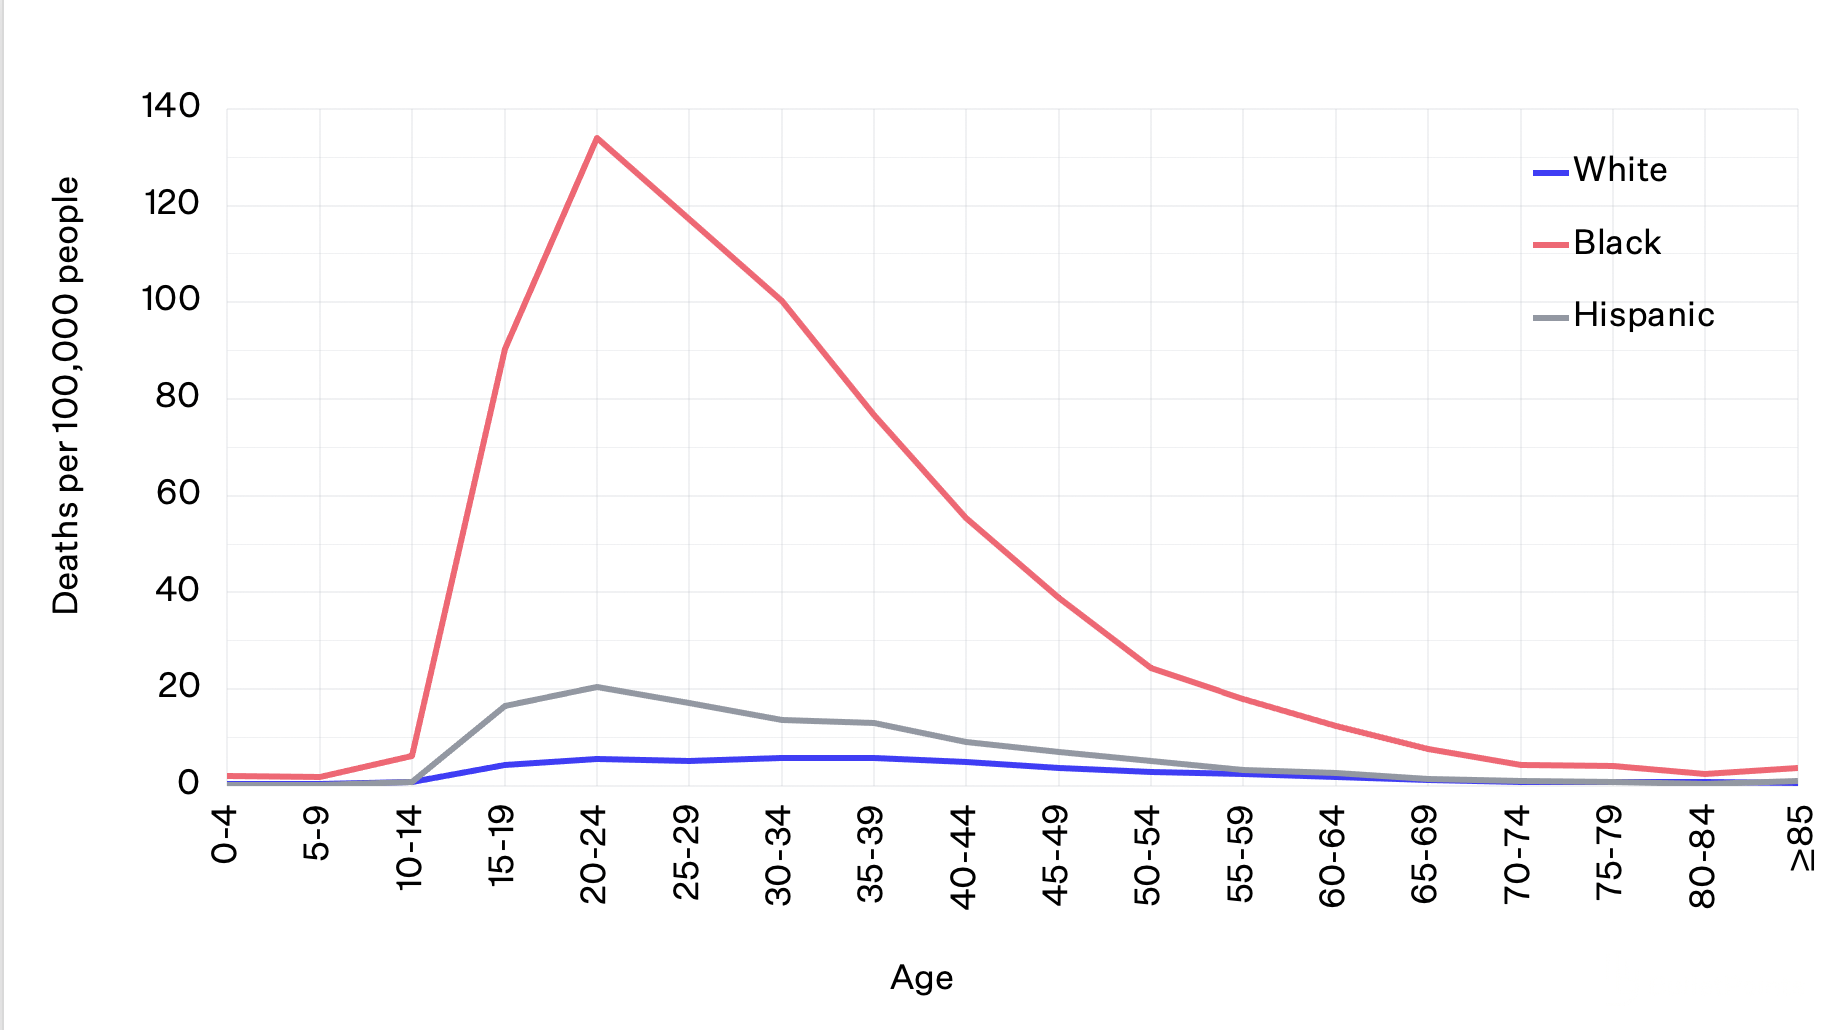
Data from CDC WISQARS. Homicides do not include death by legal intervention.
The overall firearm homicide rate has been on the rise in the US since 2014 and experienced the largest one-year increase in modern history between 2019 and 2020. Young Black males are at highest risk of death by firearm homicide: at ages 20-24, the risk of being shot and killed for Black males is about six times that of Hispanic males and American Indian/Alaska Native males and 24 times that of white males.1 Although young Black males ages 15-34 only make up 2% of the population, they accounted for 38% of all gun homicide deaths in 2020.2
Many structural inequities contribute to these disparities, including lack of economic and social opportunities, racial segregation, and historical and present policies and laws. Youth who live in cities and Black youth are more likely to be exposed to community violence than their counterparts, and being a victim of or witness to violence is correlated with perpetrating violence in the future.4
The overall firearm suicide rate rose steadily from 2006 to 2018, dipped slightly in 2019, and increased again in 2020.1 Rates of firearm suicide are historically highest among white males, and this disparity increases with age. After age 50, the firearm suicide rate for white males is at least four times that for Black or Hispanic males.
Firearm Suicide Rates for Males by Age and Race/Ethnicity, 2020
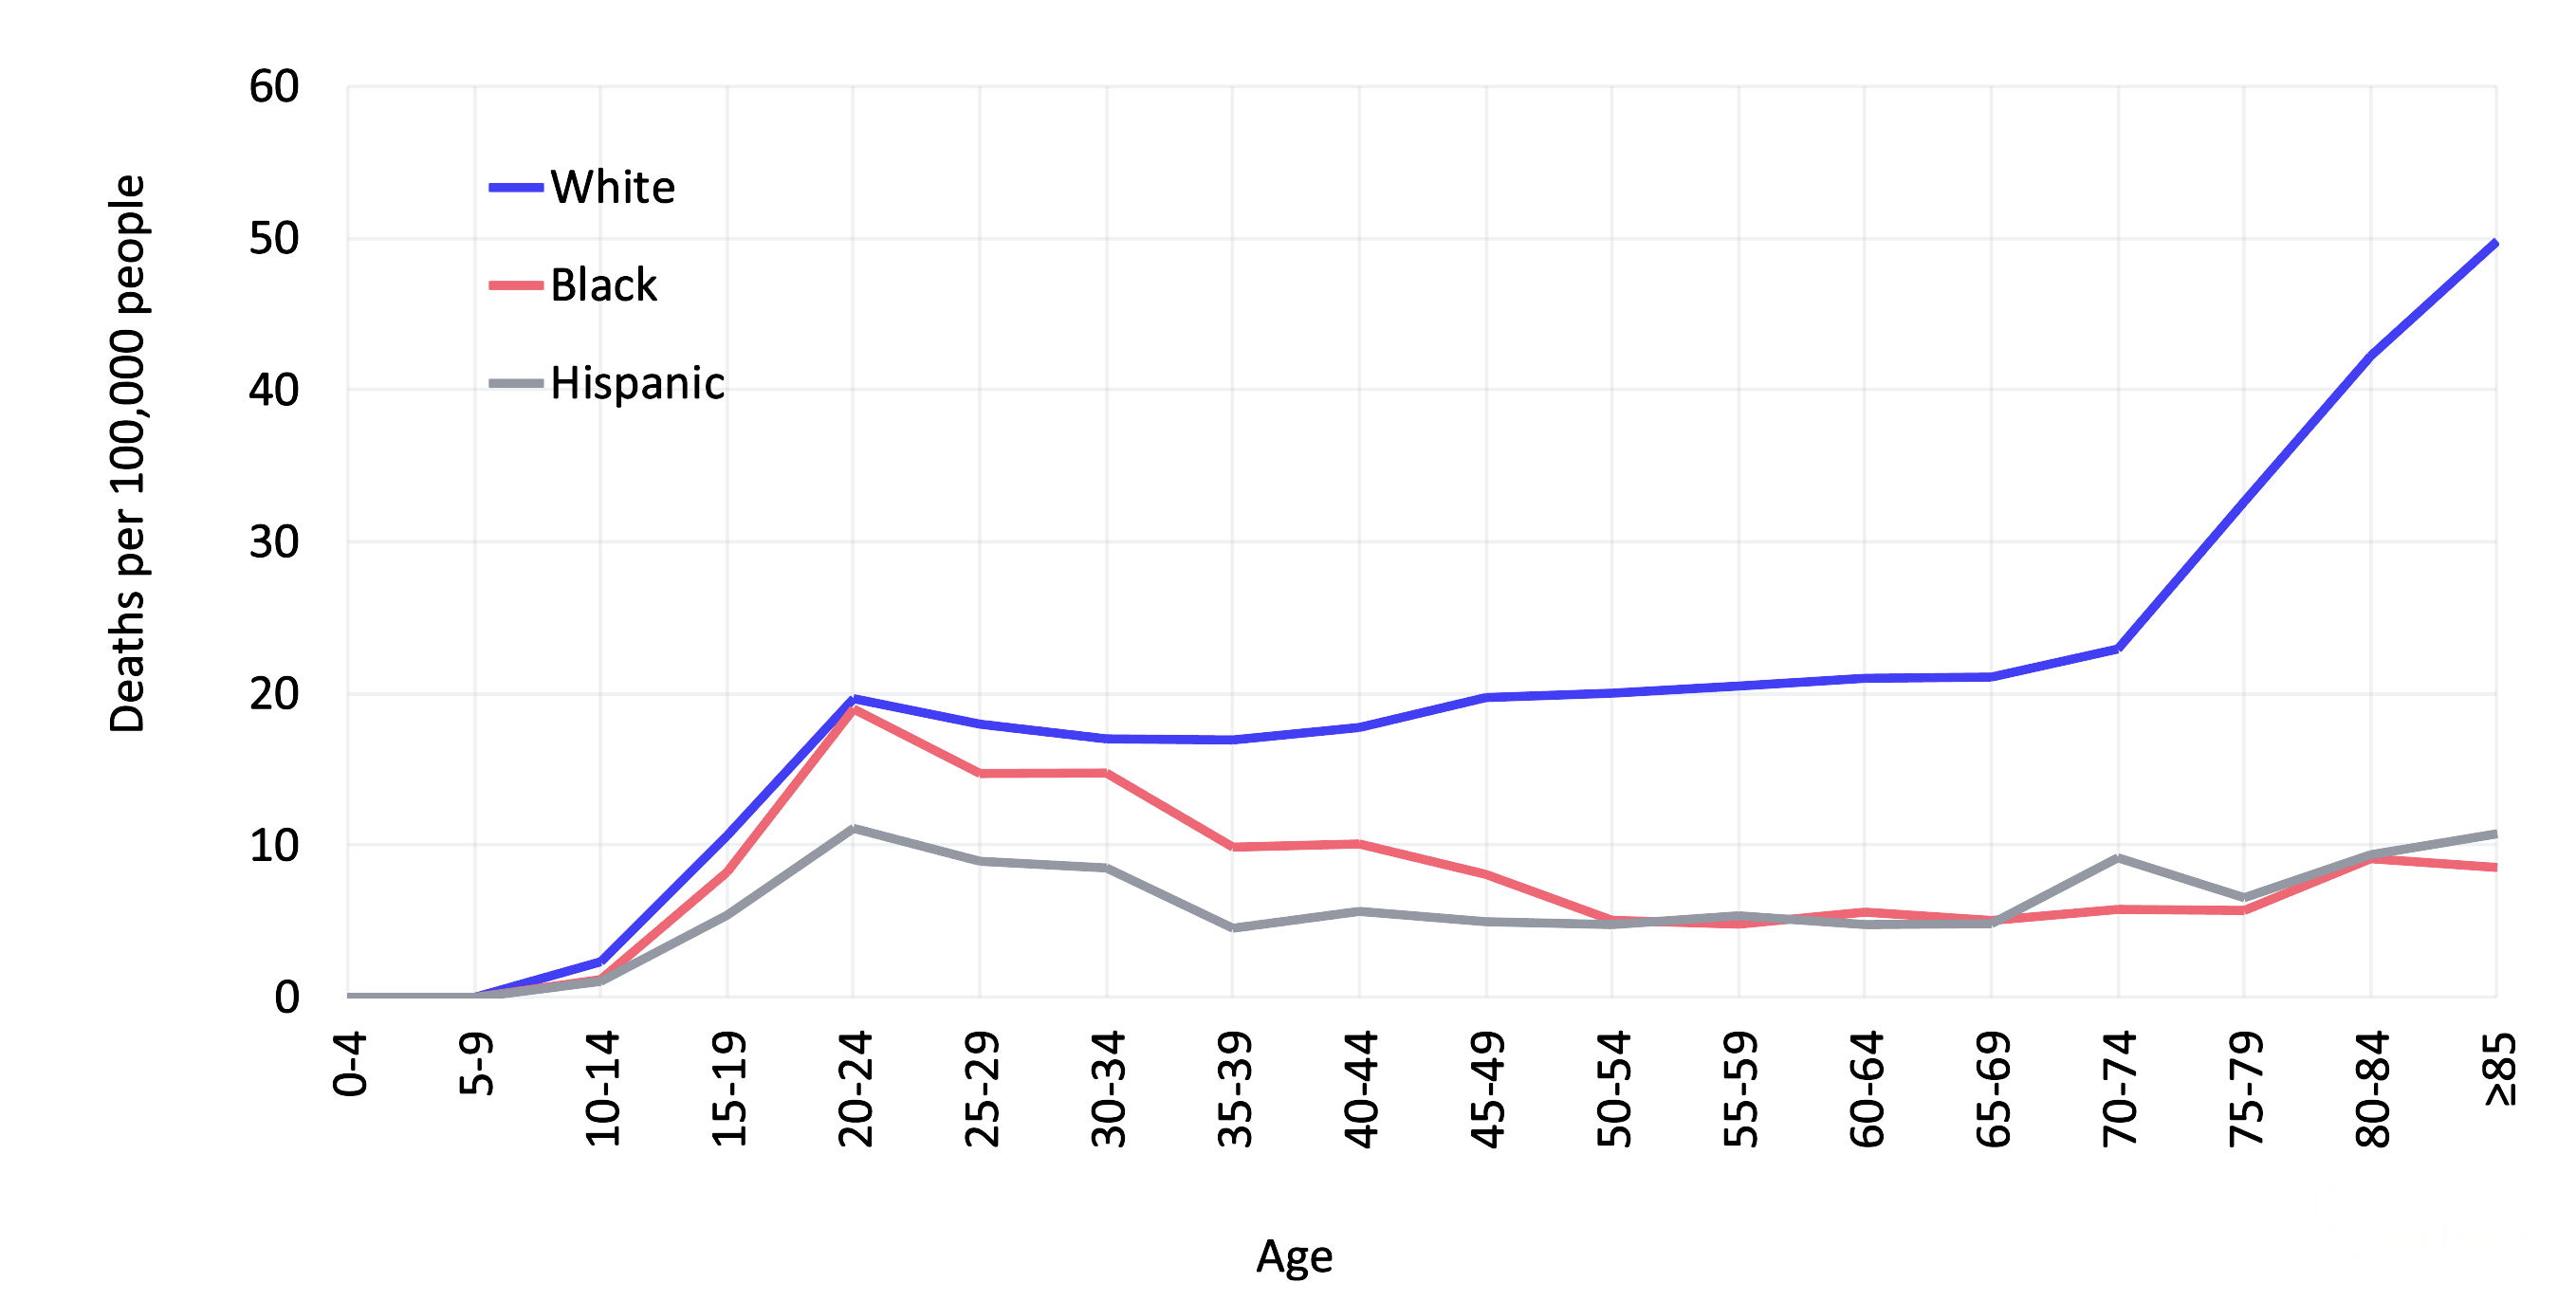
Older white men attempt suicide less often but have a higher rate of death compared to younger adults, women, and other racial/ethnic groups.5 This is likely because they have the highest prevalence of firearm ownership and are more likely to attempt with a gun.
However, in 2020, American Indian/Alaskan Native males had the highest firearm suicide rate compared to males of other races/ethnicities. This emerging trend calls attention to the increasing gun violence faced by American Indian/Alaskan Native people. Importantly, the data for this group is likely under-reported due to misclassification of race and ethnicity categories among American Indian/Alaskan Native people.6
Females’ rates of firearm deaths are substantially lower than the rates for males for both firearm suicide (five times lower) and homicide (seven times lower).1 As for males, there are also racial disparities in firearm deaths among females. Young Black females ages 20-24 have the highest rates of firearm homicide, over nine times higher than white females, almost six times higher than Hispanic females, and over four times higher than American/Indian Alaskan Native females of the same ages. In 2020, there was a 49% increase from the previous year in Black females who died by gun homicide. White and American Indian/Alaskan Native females have the highest rates of firearm suicide, two times higher than Black females and three times higher than Hispanic females. White females are overrepresented among female firearm suicide decedents since they represent 60% of females in the US but 84% of female firearm suicide decedents.2
Children and adolescents are also at risk of dying by suicide and interpersonal violence with firearms: rates of firearm homicide and firearm suicide begin to steadily increase around age 13.1 In fact, in 2020, gun violence took the lives of 4,357 children and adolescents ages 1-19. Homicides made up 64% of child and teen gun fatalities while suicides accounted for 30%.
Firearm Death Rates for Children and Adolescents by Age and Intent, 2020
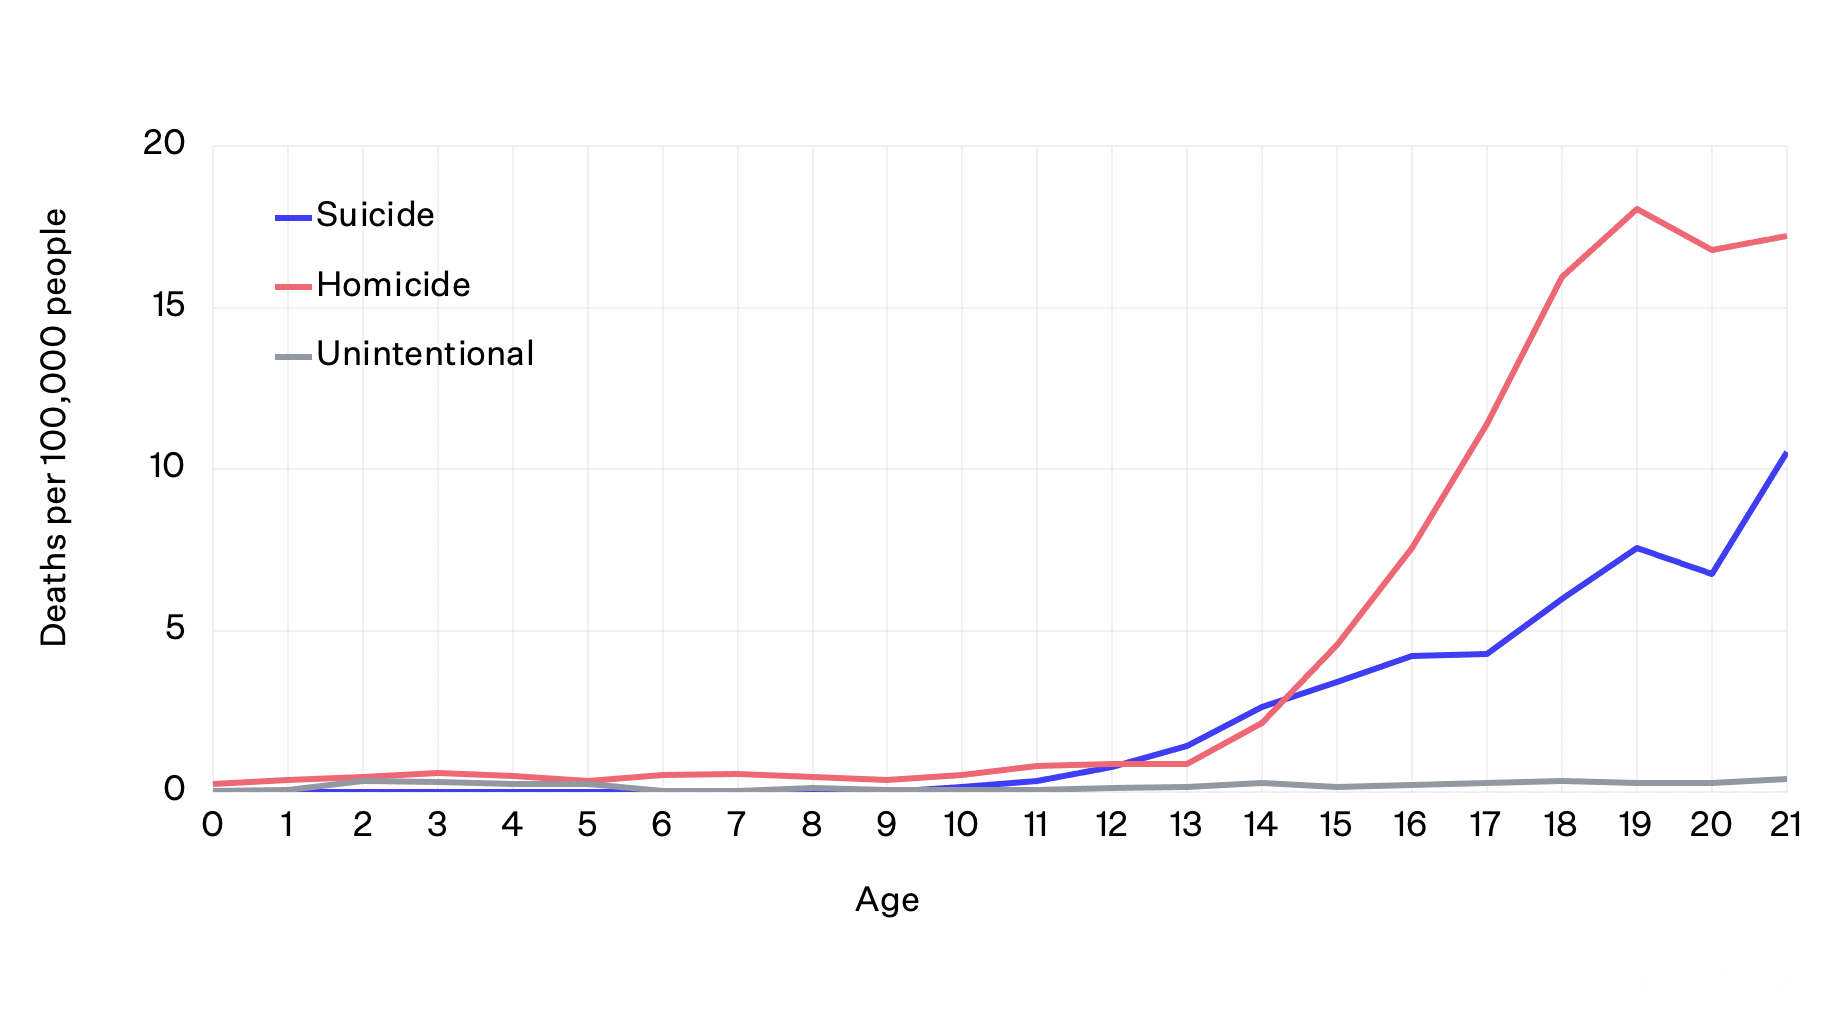 Data from CDC WISQARS. Homicides do not include deaths by legal intervention.
Clinicians should recognize that children, even at age 12 or younger, can be suicidal and may have access to firearms. In a study of four US states and two metropolitan counties, it was estimated that 85% of adolescents who died by suicide with a firearm used a gun that belonged to a family member.5
Geographic Variation in US Firearm Deaths
Age-Adjusted Firearm Homicide & Suicide Rates by State, 2019
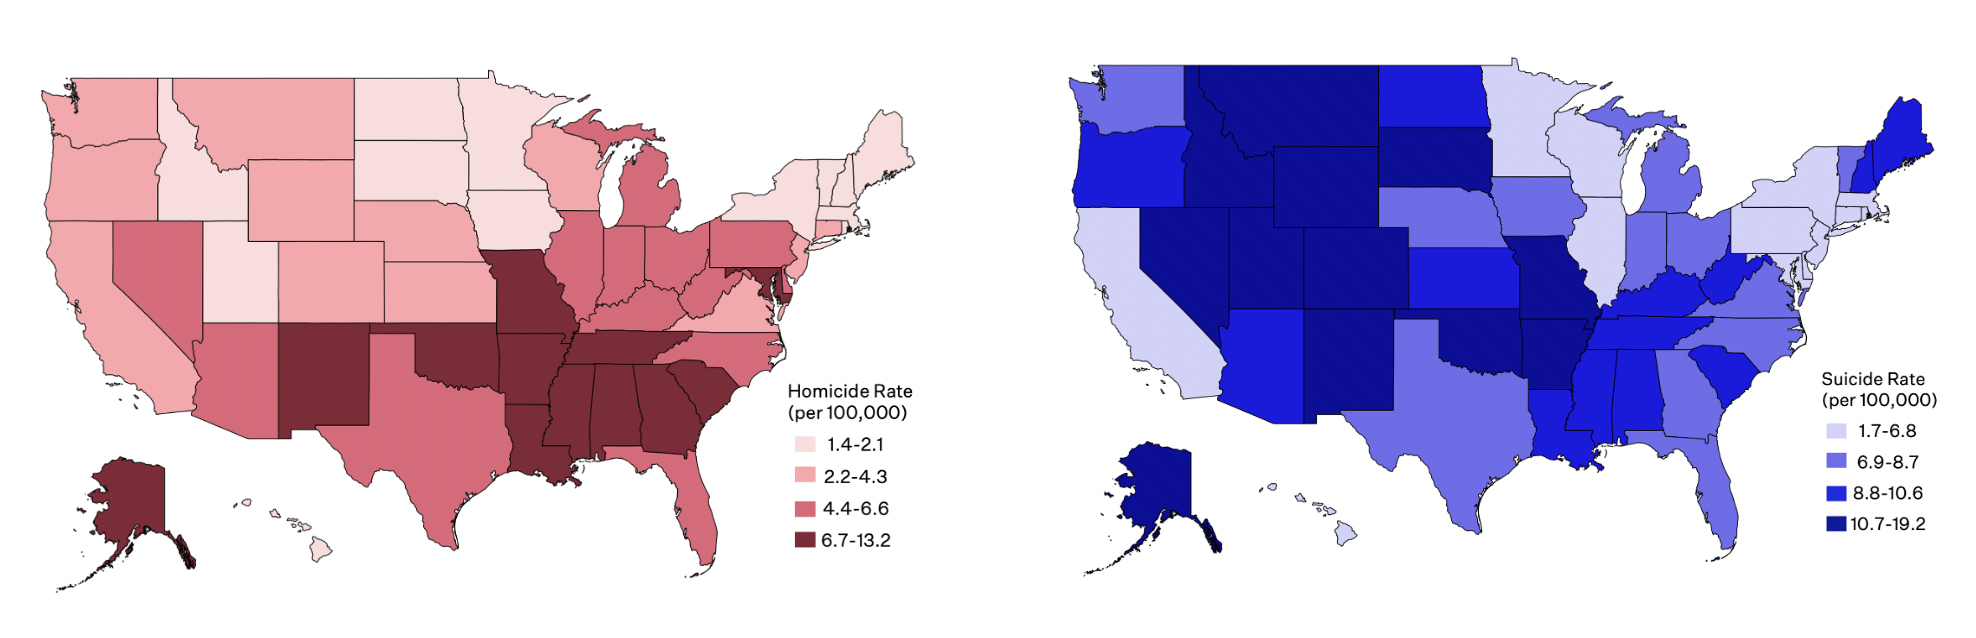
Within the US, firearm homicide and suicide rates vary demographically and geographically. Rural intermountain states, like Wyoming and Montana, have relatively high rates of firearm suicide and low rates of firearm homicide, while states in the South have disproportionately high rates of firearm homicide and about average rates of firearm suicide.1 Evidence suggests that states where more people own guns have higher rates of firearm suicide and higher rates of domestic (family or intimate partner) firearm homicides, but not non-domestic homicides.7,8
Firearm deaths affect all types of areas – urban, suburban, and rural – in the US. Research has found that the divide in total intentional firearm deaths between urban and rural counties is increasing, with rural counties bearing more of the burden.9 Notably, in 2020, rural counties had the highest firearm death rates, 1.4 times higher than large metropolitan counties. The reasons for this difference are that: firearm suicide rates are 2.1 times higher in rural versus large metropolitan counties; and firearm homicide rates are relatively similar across urbanization levels, with only slightly higher rates in large metropolitan versus rural counties. From 2016 to 2020, 13 of the 20 counties with the highest firearm homicide rates and 17 of the 20 counties with the highest firearm suicide rates were rural.2
The US spends an unprecedented amount on firearm violence, with an annual estimated cost of $229 billion.10 Direct costs are an estimated $8.6 billion; this is spent on emergency and medical services, police investigation, and court and prison costs after someone is shot. The other $221 billion are in indirect costs, including $49 billion annually for victims’ lost wages and $169 billion for the impacts on victims’ quality of life.
Firearm-Related Injuries in the US
For every person who dies from a firearm injury, another two survive. On average, over 85,000 nonfatal firearm injuries occur each year in the US, based on emergency department data.11 The total number of firearm-related injuries may in fact be higher, assuming some people receive treatment in other medical settings or don’t seek treatment at all. Of the total nonfatal firearm injuries, 51% are unintentional injuries and 41% are caused by assault. Only a small percentage (3%) of nonfatal firearm injuries are due to self-harm, since almost 90% of self-inflicted firearm injuries result in death. Across different intents of injury, most patients treated for nonfatal firearm injuries are male (88%), young (median age 25 years), and live in urban areas (71%) and low-income households (49%).
Firearm injuries tend to be more severe and costly than other injuries, and are associated with more substantial continuing morbidity. For example, patients who survive firearm injuries are more likely than those injured in motor vehicle crashes to be hospitalized, admitted to an intensive care unit, and readmitted to the hospital after discharge. Mean hospital costs and lengths of stay per patient are also greater for firearm injuries than motor vehicle crashes.12,13
Firearm Deaths in California
In California in 2020, there were 3,449 deaths from firearms—about the average annual toll of recent years—of which 50% were homicides (not including legal interventions) and 45% were suicides.1
Firearm Deaths by Intent in the US and California, 2020
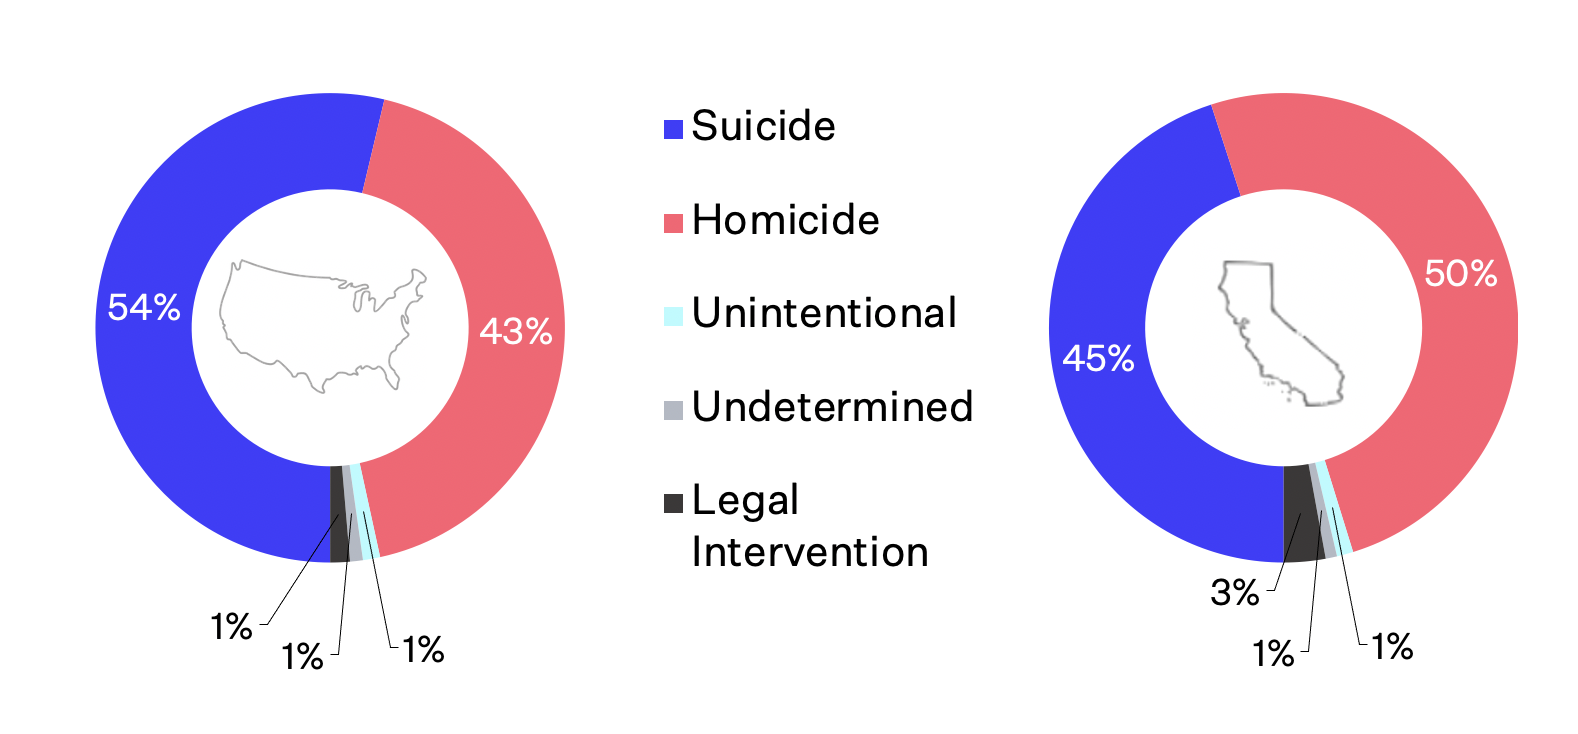
Data from CDC WISQARS.
California’s homicide and suicide rates vary by region. Reflecting national patterns, the more rural northern counties have higher rates of firearm suicide compared to urban areas like Los Angeles and San Francisco.14 Though firearms are used in over half of all suicides nationally, firearm suicides in California are more rare, comprising 37% of suicides.1
California Firearm Homicide and Suicide Rates by County, 2015
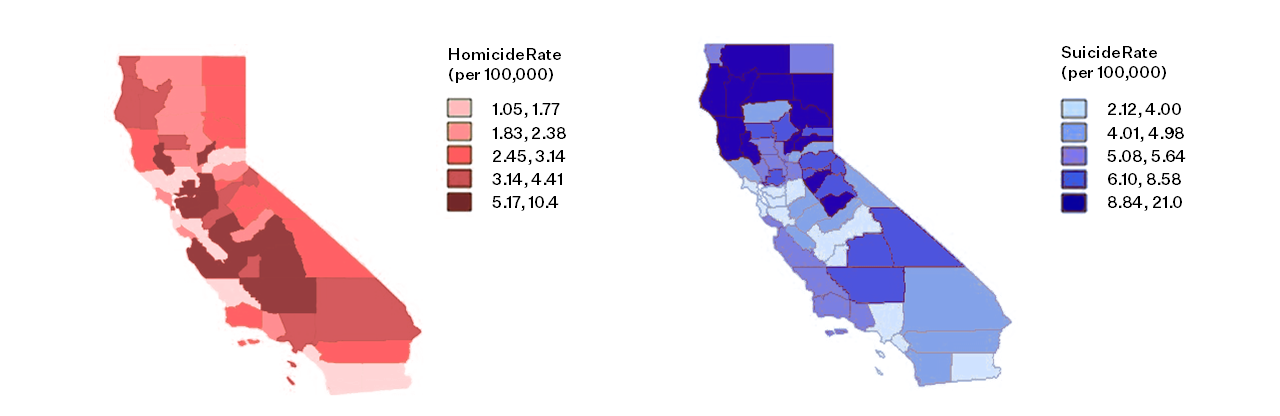
Firearm homicide rates in California, which fell in the early 2000s and began to increase again in 2015, are highest in the San Joaquin Valley.15 Los Angeles County, where one-quarter of California’s population resides, drove that initial decrease: the firearm homicide rate there declined by 54% from 2002 to 2015, which was the end of the study period, primarily due to a reduction in firearm homicides among Hispanic men.
In 2020, California ranked 45th of the 50 states for its overall gun death rate, 29th for its firearm homicide rate, and 44th for its firearm suicide rate.1 Although its rates are relatively low, the state has a large burden of firearm death—more than 7% of firearm deaths in the country—because of its large population.
California’s Firearm-Related Injuries
Each year in California, there are an average of more than 7,000 nonfatal firearm injuries that affect primarily men (90%).17 The majority (70%) of those injuries are assaults, with victims more likely to be younger (average age 27 years) and Black (33%) or Hispanic (46%). Approximately one-quarter (24%) of those injuries are unintentional, with victims more likely to be older (average age 42 years) and white (62%), and 2% are due to self-harm.
Page last updated October 2022.
- Web-based Injury Statistics Query and Reporting System (WISQARS) [online].
- A Year in Review: 2020 Gun Deaths in the U.S.
- US Mass Shootings, 1982-2020: Data From Mother Jones’ Investigation.
- Predicting violent behavior: The role of violence exposure and future educational aspirations during adolescence. Journal of Adolescence.
- Suicide acts in 8 states: Incidence and case fatality rates by demographics and method. American Journal of Public Health.
- In Indian country, a crisis of missing women. And a new one when they’re found.
- Household firearm ownership and rates of suicide across the 50 United States. The Journal of Trauma.
- Firearm ownership and domestic versus nondomestic homicide in the U.S. American Journal of Preventive Medicine.
- Firearm Death Rates in Rural vs Urban US Counties. JAMA Surgery.
- The true cost of gun violence in America.
- Epidemiologic trends in fatal and nonfatal firearm injuries in the US, 2009-2017. JAMA Internal Medicine.
- Risk of 90-day readmission in patients after firearm injury hospitalization: a nationally representative cohort study. Journal of Injury and Violence Research.
- Comparison of cost and resource utilization between firearm injuries and motor vehicle collisions at pediatric hospitals. Academic Emergency Medicine.
- Firearm mortality in California, 2000–2015: The epidemiologic importance of within-state variation. Annals of Epidemiology.
- Incidence, distribution, and lethality of firearm injuries in California from 2005 to 2015. JAMA Network Open.
For more information, see these peer-reviewed articles.
Kaufman, E. J., Wiebe, D. J., Xiong, R. A., et al. (2020). Epidemiologic trends in fatal and nonfatal firearm injuries in the US, 2009-2017. JAMA Internal Medicine.
Hemenway, D. & Nelson, E. (2020). The scope of the problem: gun violence in the USA. Current Trauma Reports.
Pear, V. A., Castillo-Carniglia, A., Kagawa, R. M., et al. (2018). Firearm mortality in California, 2000–2015: The epidemiologic importance of within-state variation. Annals of Epidemiology.
Rivara, F.P., Studdert, D.M., Wintemute, G.J. (2018). Firearm-related mortality: a global public health problem. JAMA.
Wintemute, G.J. (2015). The epidemiology of firearm violence in the twenty-first century United States. Annual Review of Public Health.
Additional Resources on the Epidemiology of Firearm-related Injury
Physicians and Firearms
Part one of an online course covering the epidemiology of gun violence. The curriculum is developed by medical students to bridge the gap in medical education to address gun violence as a public health epidemic.
Web-based Injury Statistics Query and Reporting System (WISQARS)
The Centers for Disease Control and Prevention, National Center for Injury Prevention and Control has created an interactive, online database, WISQARS, to compile data about fatal and nonfatal injury, violent death, and cost of injury. This database is accessible to the public.
Firearm Injury is a public health issue: here’s what you can do.
An informational video by Osmosis on the epidemiology of firearm-related injuries, its history in public health research, and what you can do.